
Quick Answer: Rising STD statistics don’t always mean infections are surging, they often reflect better testing, increased awareness, and improved reporting. To really get a handle on risk, you need to look at testing rates, silent infections, and the people who aren't getting the data.
Scene One: The Google Spiral
Jules, 24, stared at her phone while parked outside a 24-hour pharmacy. Her Tinder date from last weekend had just texted: “Hey, just a heads up, I tested positive for chlamydia.” She searched “chlamydia symptoms,” “what does a positive mean,” and then, inevitably, “STD rates in my area.” What came up looked like a disaster map, heat zones, infection counts, steep arrows pointing upward.
“Am I part of some huge epidemic?” she wondered. “How did I miss this?” But here’s the thing, those numbers often miss more than they reveal. What Jules was seeing wasn’t an outbreak in real time. It was the cumulative result of complex systems: who gets tested, who doesn’t, how often, and what gets reported to public health departments. And most importantly, what doesn’t.
Why the Numbers Look Scary, But Aren’t Always
Let’s start with the obvious: yes, many STIs have increased in reported cases over the past decade. According to the CDC’s annual STD Surveillance Report, chlamydia, gonorrhea, and syphilis cases have all seen record highs. But those increases aren’t always because more people are getting infected. Sometimes it's because more people are finally being tested and diagnosed, especially those who weren't noticed before.
For instance, expanded screening programs in colleges, LGBTQ+ clinics, and rural telehealth have helped uncover silent infections. When more people test, more infections are detected. That’s a public health win, even if the stats make it look like a disaster.
| Year | Chlamydia (Reported Cases) | Gonorrhea (Reported Cases) | Syphilis (Primary & Secondary) |
|---|---|---|---|
| 2015 | 1,526,658 | 395,216 | 23,872 |
| 2018 | 1,758,668 | 583,405 | 35,063 |
| 2022 | 1,644,416 | 710,151 | 54,671 |
Figure 1. Reported STI case trends in the U.S. from CDC data. Case counts increase as testing expands and reporting improves, not solely due to transmission spikes.

People are also reading: Can You Get the Chlamydia Vaccine Yet? Here’s the Real Timeline
What Counts, and What Doesn’t, in the Data
Let’s say you take an at-home STD test. You swab, test, get a positive result, and treat it. That result may never make it into national statistics, unless it’s reported by a lab or clinic. Self-diagnosed and self-treated cases often stay invisible. Likewise, people who never get tested, even if infected, aren’t included. That means every STD statistic you see is really just a count of the people who showed up in the system. Not the full picture.
This matters when interpreting who’s at risk. If young Black women in the South show high rates of gonorrhea, for example, that doesn’t mean they’re more sexually active or careless. It may reflect better outreach testing programs in those communities, while wealthier white populations with equal or higher risk simply don’t test as often, or aren’t diagnosed.
In short: data is political. It’s social. It’s incomplete. But it’s not useless. You just have to read between the lines.
Testing = Data (And Data = Hope)
Marcus, 31, had avoided clinics for years. After a scare, he finally ordered a combo STD test kit online. It came in discreet packaging. He followed the instructions, waited ten minutes, and stared at the faint line on the syphilis strip. Positive.
His stomach dropped. He hadn’t had symptoms. He hadn’t felt sick. But that faint line meant he’d caught something early, something he never would’ve known about otherwise. He saw a doctor the next week, started treatment, and let his last partner know.
That one test result, Marcus’s, is part of a broader story. More testing means more detection. More detection means fewer untreated infections, fewer long-term complications, and fewer people unknowingly passing it on. The data may look worse, but the outcomes are better.
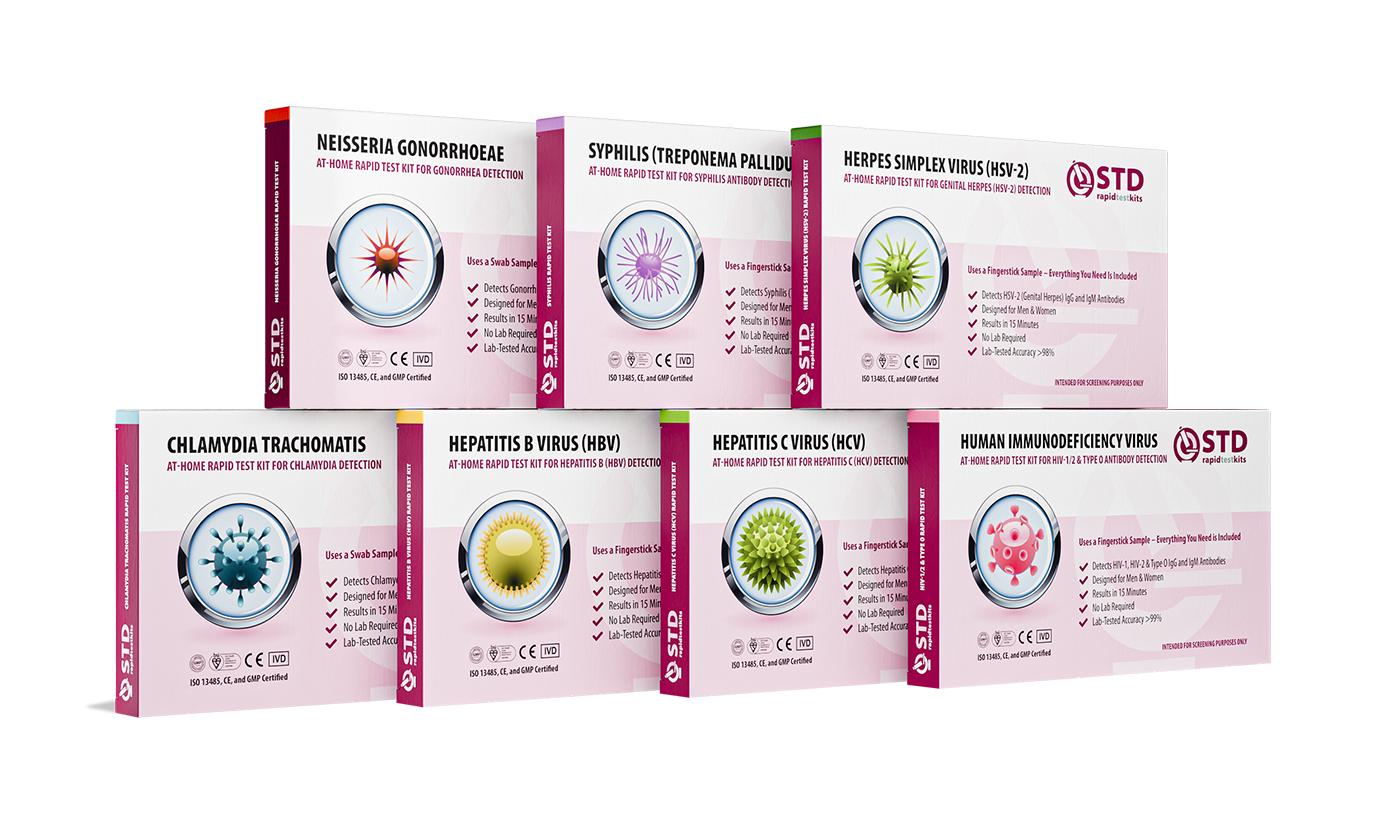
At-home testing options like STD Rapid Test Kits let people like Marcus take control without shame or clinic barriers. And when more people take control, the numbers change, not just upward, but forward.
Check Your STD Status in Minutes
Test at Home with Remedium8-in-1 STD Test Kit

 For Men & Women
 Results in Minutes
 No Lab Needed
 Private & Discreet
Order Now $149.00 $392.00
For all 8 tests
The Myth of “Most Infected” States
You’ve seen the clickbait headlines: “Alabama is the STD Capital of America.” “Mississippi Tops Syphilis List Again.” These rankings often come from annual CDC heat maps showing infections per 100,000 people. But context matters. A state with more aggressive testing programs or better public health infrastructure will naturally report more cases. That doesn’t mean people in those areas are having more sex or taking more risks. It often just means they’re getting tested more often.
Likewise, under-resourced or rural states might have low reported rates, not because STDs aren’t there, but because testing isn’t. Fewer clinics, more stigma, and lack of insurance all drive infections underground. So when someone says, “My state is safe,” they might actually mean “My state doesn’t track well.”
| State | Chlamydia Rate (per 100,000) | Testing Access Score |
|---|---|---|
| Louisiana | 719.8 | High |
| New Hampshire | 209.3 | Low |
| California | 506.5 | Moderate |
Figure 2. Reported chlamydia rates vs. access scores. High rates often reflect high testing, not necessarily high risk. Scores reflect availability of free testing centers, mobile units, and school-based screenings.
False Spikes and the "Testing Boom" Effect
Sometimes STI trends explode not because of what’s happening in bedrooms, but because of what’s happening in clinics, schools, or legislation. For example, after a statewide campaign in Nevada offering free testing to all college students, reported cases of chlamydia doubled. Media outlets called it a crisis. But what actually happened? A bunch of people who had never tested before suddenly did. That’s not a spike in risk, it’s a breakthrough in detection.
Public health officials call this the “testing boom” effect. When access goes up, so do case numbers. It’s like turning the lights on in a messy room. The mess didn’t just appear, it was always there. You’re just finally seeing it. And when testing stops or slows down, like during the first year of the COVID-19 pandemic, case numbers can appear to drop, even if infections are quietly spreading unchecked.
This is why it’s dangerous to interpret year-over-year STD increases without looking at testing volume, healthcare policy, and outreach funding. A drop in cases might reflect a collapse in services. An increase might reflect that people are finally being seen. The data doesn’t lie, but it doesn’t always speak plainly either.
Where the Silence Lives: Underreporting and Exclusion
Let’s talk about who’s not in the data. Because when we say “underreporting,” we don’t just mean missed paperwork. We mean entire populations erased from the story.
Many undocumented individuals avoid public clinics out of fear. Queer youth might hide symptoms from family-linked health plans. Sex workers may get tested at informal networks that don’t report results. And then there’s the prison system, where STI rates are notoriously high, but surveillance is inconsistent at best. These aren’t fringe exceptions. They’re systemic blind spots.
So if a report says "Black gay men in urban centers are most at risk," we need to ask: most at risk compared to who? Compared to undercounted rural straight men who never test? Or to people with multiple partners who use private concierge clinics that don’t share data? We don’t say this to cast doubt on science, we say it to sharpen it. To make it better. To make it honest.
Case Study: When Silence Skews the Story
Lena, 38, worked two jobs and didn’t have insurance. After a rough breakup, she started having symptoms but waited it out. No time. No money. No backup plan. By the time she got tested at a community pop-up event three months later, she had active gonorrhea and trichomoniasis. Her results got counted in that year’s statistics, but her months of being unknowingly contagious never did.
Lena’s story is common. And it reveals the quiet undercurrent in all STI data: the delay between infection and detection. What you see on this year’s graph might be what happened to someone six months ago. What’s showing up as “today’s trend” may already be outdated. That’s why personal vigilance, not panic, is still your best tool.
How to Actually Use STI Statistics
If the numbers aren’t perfect, then what’s the point? Here’s the truth: STI statistics are useful when you treat them as conversation starters, not verdicts. Use them to guide public health funding. Use them to check where services are lacking. Use them to know that yes, STIs are common and increasing, but that testing, treatment, and prevention are widely available.
And when you look at those maps again, don’t read them as “where people are dirty.” Read them as “where people are showing up to care.” Red zones don’t mean moral failure, they mean data is working. And green zones might not be safer. They might just be quieter.
If you’re in a “hot zone” and feeling overwhelmed, remember: this isn’t about blaming cities, states, or communities. It’s about making sense of a public health landscape that’s finally, if imperfectly, being mapped. And you have every right to ask more from that map.
When It’s Personal, Not Just Statistical
For many readers, the fear isn’t really about the charts. It’s about what those charts imply: That your choices, your partners, your body, might be dangerous. That maybe you already have something and don’t know it. That sex carries consequences you weren’t ready for. And yes, those are valid fears. But they’re not the whole story.
Testing doesn’t exist to catch you in a mistake. It exists to empower you. It’s an act of self-knowledge, not self-punishment. And the more we all normalize testing, the more we see STIs as medical conditions, not moral judgments, the closer we get to lowering those rates in reality, not just in graphs.
So the next time you see a scary headline, take a breath. Ask what it’s really measuring. Ask who’s included. Ask who’s left out. And then ask yourself: What do I need to feel safe, informed, and in control right now?
For many people, that starts with a single, discreet test. You can order an at-home kit here, test in private, and get results in minutes. No clinic. No waiting room. No panic spiral. Just clarity.
Why Panic Doesn’t Prevent Anything (But Data Can)
Let’s be blunt: fear doesn’t make people test. It makes them freeze. It makes them avoid. It makes them delay. Public health campaigns that scream “epidemic” often forget the emotional cost of alarmist messaging. When you tell people their city is an STI hellscape, they don’t flock to clinics, they close their tabs and try not to think about it. And that helps no one.
What works better? Specific, grounded information. Calm, shame-free education. Real stories, not scare tactics. When people understand how STIs work, how you can get chlamydia without symptoms, how herpes can spread from oral sex, how HIV is now manageable with early treatment, they make smarter, safer choices. No shame required.
This is why interpreting STI statistics correctly is so important. It shapes how we talk about sex. How we fund programs. How we treat people who test positive. And how we see ourselves in those numbers, either as cautionary tales or informed agents of our own care.

People are also reading: What Does Chlamydia Feel Like? Symptoms in Men and Women
What the Data Really Wants You to Know
Look deeper into the trends, and one message becomes clear: STIs don’t discriminate, but care often does. Higher rates in Black, Indigenous, LGBTQ+, and low-income communities aren’t about riskier behavior. They’re about who has access to care, and who’s ignored by systems until it’s too late.
When you see rising gonorrhea in queer men or increased syphilis in pregnant women, that’s not a warning to avoid those groups. It’s a reminder to invest in them. To fund outreach. To support free testing. To make sure that behind every number is a person with a plan, not just a statistic with a stigma.
You are not your ZIP code. You are not your last partner. You are not your panic. You are a person capable of clarity, and the data, if you read it right, wants that for you too.
Your Power Is in the Follow-Up
Let’s say you test today and your results are negative. Great. But the window period matters, some infections take days or weeks to show up. Maybe your test is a snapshot, not a full movie. So what do you do? You plan the next one. You stay aware of your body. You open honest conversations with partners. And you treat testing not as a one-time panic button, but as a routine part of staying sexually well.
If your result is positive? You’re not alone. Millions test positive each year. Most STIs are curable. All are manageable. And treating them helps you, your partners, and yes, the stats. Every treated infection is one that doesn’t get passed on. One that doesn’t become a “case” on next year’s chart. You literally change the data when you care for yourself.
Need a safe place to start? STD Rapid Test Kits offers doctor-trusted, discreet test kits you can use at home. No insurance, no awkward appointments. Just answers.
Check Your STD Status in Minutes
Test at Home with Remedium7-in-1 STD Test Kit
 For Men & WomenResults in MinutesNo Lab NeededPrivate & Discreet
Order Now $129.00 $343.00
For all 7 tests
Privacy, Power, and Your Testing Timeline
Adrian, 29, lives in a small conservative town. The closest clinic is 40 minutes away. He doesn't want to run into anyone he knows. So he orders an at-home test, takes it on his lunch break, and gets a negative result. Not because he thought something was wrong, but because he wanted to know. That’s power.
Your sexual health doesn’t need to be dramatic to matter. Testing isn’t just for when things go wrong, it’s part of what keeps things going right. And doing it privately, on your terms, is what makes that care sustainable. Especially if you’re managing anxiety, navigating stigma, or just figuring things out.
Rapid tests make it easy to check in regularly. You can even build it into your calendar the same way you do dentist appointments or oil changes. Not because you’re “high risk.” Because you’re responsible, and you value clarity over assumption.
It’s Not About the Numbers. It’s About You.
Every bar graph and data point has a story behind it. It could be a choice to test, a surprise outcome, a calm conversation, or a new strategy. And that’s what matters more than any chart. Rising STD stats aren’t your doom, they’re your invitation. To act. To learn. To care. And to refuse shame as part of the process.
You don’t have to wait for better data. You can be the data. You can test, treat, and tell your story. You can be part of a new wave of sexual health that isn’t afraid of numbers, but insists on reading them with care.
So breathe. Take a step. And remember: whether you test today or tomorrow, whether your results are clear or complicated, you’re not alone. You’re just one more person choosing clarity in a world that still prefers silence.
FAQs
1. Why are STD rates always going up in the news?
Because we're finally paying attention. More people are testing, more labs are reporting, and more clinics are catching what used to go undetected. Rising numbers don't always mean rising risk, they can also mean rising care. It’s messy math with a hopeful twist.
2. So does living in a “high STD” state mean I’m at higher risk?
Not necessarily. If your state has better outreach, free testing vans, or school clinics, the numbers go up, not because people are reckless, but because the system is working. Ironically, the “safest” looking places on a map might just be where no one’s looking.
3. Are these stats telling the truth, or just part of it?
They're telling a version of the truth. But there are holes, big ones. At-home results, underfunded rural clinics, undocumented folks avoiding care, people testing but never reporting, it all creates gaps. The real picture is blurrier, but also more human.
4. Why do some groups seem overrepresented in STI data?
Because we test them more. Black women, queer men, and low-income communities often get more screening thanks to targeted public health programs. That’s not a reflection of “bad behavior”, it’s a reflection of access. And sometimes bias.
5. How do I make sense of those scary-looking STD maps?
Zoom out, literally and emotionally. Maps show reported cases per 100,000 people, but they don’t show how many people didn’t test. Or how many clinics closed. Or how stigma keeps things quiet. Use them for awareness, not for judgment.
6. Can I still have an STD if my partner tested negative?
Yep. Window periods matter. Some infections take days or weeks to show up. A negative test today doesn’t always mean no infection, it might just be too early. If in doubt, retest later or use a different type of test. You’re not being paranoid, just thorough.
7. Do I need to test if I feel totally fine?
100% yes. Most STIs don’t throw obvious symptoms, especially in the early stages. Chlamydia, for example, can hang out quietly for months. Testing when you feel fine isn’t overreacting. It’s just smart.
8. I saw a faint line on my at-home test. What does that mean?
Even a faint line can mean that the test is positive. Some infections don't cause strong chemical reactions, but they are still there. If you're not sure, test again or call the lab. When in doubt, treat it like a maybe and take the next step calmly.
9. How often should I really be testing?
If you’re sexually active with new or multiple partners, every 3–6 months is a solid rhythm. More often if you’ve had a known exposure, skipped protection, or just want peace of mind. Testing doesn’t mean you’re reckless, it means you’re real about your health.
10. What’s the easiest way to test without going to a clinic?
At-home rapid test kits. No waiting rooms, no awkward check-ins, no “why are you here today?” Just you, the instructions, and an answer in minutes. This combo kit is discreet, quick, and checks for the most common infections in one go.
You Deserve More Than a Scary Headline
Even a faint line can mean that the test is positive. Some infections don't cause strong chemical reactions, but they are still there. If you're not sure, test again or call the lab. You’re a person navigating sex, care, curiosity, and sometimes anxiety. And that deserves compassion, not fear.
If this article made you rethink how STI data works, that’s a good thing. If it made you want to test just to be sure, that’s even better. Because knowledge is power. Testing is a way to show that you care about more than just yourself.
This at-home combo test kit checks for the most common STDs discreetly and quickly. Whether you're anxious, curious, or just ready to stop guessing, you’ve got options.
How We Sourced This Article: We combined current guidance from leading medical organizations with peer-reviewed research and lived-experience reporting to make this guide practical, compassionate, and accurate.
Sources
1. CDC STD Surveillance Reports
2. Planned Parenthood – Get Tested
4. Sexually Transmitted Infections Surveillance, 2024
5. Sexually Transmitted Infections Prevalence, Incidence, and Cost Estimates
6. CDC Releases 2024 National STI Data
7. Sexually Transmitted Infections (WHO Fact Sheet)
8. The State of STIs: Infographic & Graphics
9. Sexually Transmitted Diseases (STD) – FastStats
10. STIC Figure 2.0 – CDC Tool for STI Prevention Impact
About the Author
Dr. F. David, MD is a board-certified infectious disease specialist focused on STI prevention, diagnosis, and treatment. He blends clinical precision with a no-nonsense, sex-positive approach and is committed to expanding access for readers in both urban and off-grid settings.
Reviewed by: Dr. Melina Cruz, MPH | Last medically reviewed: December 2025
This article is for informational purposes and does not replace medical advice.


