What on Earth Is GLASS Anyway?
GLASS launched in 2015 as WHO’s answer to a messy, country-by-country patchwork of lab results. It merges two streams: GLASS-AMR (Antimicrobial Resistance) and GLASS-AMC (Antimicrobial Consumption), letting analysts compare how much antibiotic we swallow against how many bugs are fighting back. The system now pulls data from more than 120 countries and territories, each following the same laboratory standards, so the numbers line up like apples-to-apples comparisons rather than a fruit-salad of mismatched methods.
Every year WHO drops a mammoth PDF brimming with tables: bloodstream infections, urinary infections, and special breakout sheets for sexually transmitted pathogens. Each row is a country; each column is either a year or a drug class. The colours? Think traffic lights, green means susceptible, yellow is warning, red screams “treatment in trouble.”
But here’s the catch: even seasoned clinicians admit the layout can induce drowsiness. If the jargon, “3GC-R E. coli”, doesn’t get you, the small font will. That’s why we’re spending the next ten minutes flattening the learning curve.

People are also reading: Kissing Goodbye to Quick Cures: AMR’s Brutal Reality Check on Casual Sex
Why Should You Care? (Hint: It’s Your Body on the Line)
Antimicrobial resistance (AMR) kills an estimated 3,500 people every day worldwide, a toll higher than HIV and malaria combined. In the United States alone, the CDC tallied over 2.8 million drug-resistant infections in 2023, costing $4.8 billion in direct health-care expenses. Those stats may feel abstract, until you realise the first-line antibiotic your doctor prescribes for a raging UTI or persistent sore throat might already be ineffective in your zip code.
For sexually active folks, the stakes get personal fast. Gonorrhoea evolved resistance to every class of antibiotics ever thrown at it, and scientists warn that untreatable strains are on the horizon. When WHO’s GLASS tables show a country hitting double-digit resistance to ceftriaxone (the last reliable shot), it means each untested hookup becomes riskier than last year. That’s why pairing data awareness with routine self-screening is the modern version of wearing a seatbelt.
Anatomy of a GLASS Table, Row by Row, Column by Column
Open any GLASS PDF and head to the “Bloodstream Infection” sheet. You’ll spot a grid that looks like a high-school chemistry quiz. Here’s the decoder ring:
- Rows: Countries, territories, or areas reporting data.
- Columns 1–3: Year, number of isolates tested (n), testing coverage.
- Columns 4–8: Percentage of isolates resistant to key antibiotics (think third-generation cephalosporins for E. coli, methicillin for S. aureus).
- Shading: GLASS uses a heat-map gradient, pastel for low resistance, deep scarlet for danger zones.
The beauty of this uniform layout is that a single scanning trick works anywhere: focus on the right-most “% R” columns, where red cells clump. Horizontal analysis = cross-country comparison for one year. Vertical analysis = trendline for one country over time. Toss in testing coverage, a tiny “n” can exaggerate percentages, and you’ve mastered 80 % of the interpretive workload.
Still awake? Good. Next up, let’s pull out 2025’s headline numbers.
The 2025 Shockers: New Numbers You Can’t Ignore
WHO’s May 2025 data release shows a median 39.9 % of E. coli bloodstream isolates worldwide now resist third-generation cephalosporins, up from 36 % the previous year. In practical terms, nearly two out of five patients may need a pricier or more toxic backup drug for what used to be a routine infection.
Flip to the GLASS “Gonorrhoea” sheet and the tension spikes: 12 countries reported ≥10 % resistance to ceftriaxone, the last-line injectable. Six of those hit the threshold for treatment guideline changes, and three were popular travel destinations in Southeast Asia. (Pack condoms, and a test kit.)
The WHO 2024 Bacterial Priority Pathogens List ups the urgency by ranking Neisseria gonorrhoeae in its “High Priority” tier alongside pan-resistant Acinetobacter and carbapenem-resistant Klebsiella. It’s official: the bugs behind common STIs are elbowing into the same danger bracket as hospital superbugs.
Check Your STD Status in Minutes
Test at Home with RemediumGonorrhea Test Kit
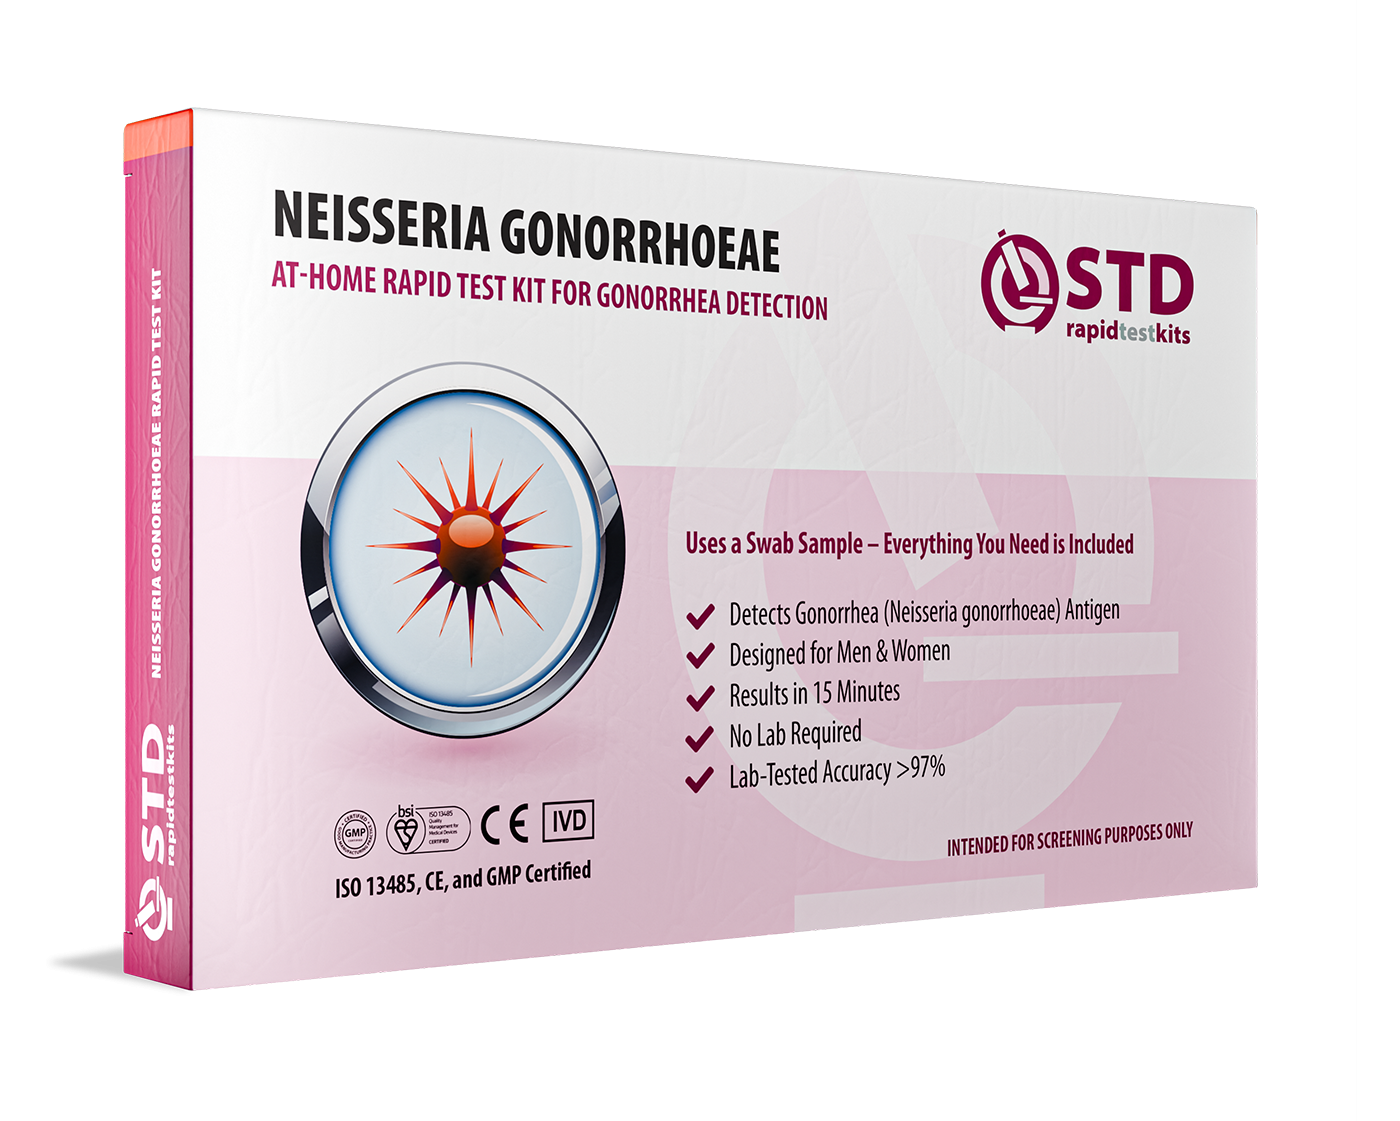
 For Men & Women
 Results in Minutes
 No Lab Needed
 Private & Discreet
Order Now $33.99 $49.00
Gonorrhoea in the Red Zone: Decoding the GASP + GLASS Mash-Up
Two acronyms, one headache. While GLASS collects broad AMR data, the Global Gonococcal Antimicrobial Surveillance Programme (GASP) zooms in on gonorrhoea specifically. The 2024 GASP bulletin shows that Southeast Asia, and worryingly, parts of Southern Europe, are reporting azithromycin resistance above 20 %, a level at which dual therapy begins to wobble. When GASP and GLASS agree on rising resistance, clinicians move from “watchful waiting” to revising treatment protocols.
Case in point: Scotland. A March 2025 study documented the country’s first confirmed cluster of ceftriaxone-resistant Neisseria gonorrhoeae infections, all linked by a dating-app network.Public-health teams could trace the risk back to GLASS tables showing creeping cef-R percentages climbing from 0 % in 2020 to 6 % in 2023. That’s the power of data: numbers whisper before outbreaks shout.
The 3-Minute Skim: A Speed-Reading Ritual That Works Every Time
Grab a fresh GLASS PDF and set a three-minute timer. You’re not trying to crunch every decimal, just hunting for hotspots. Follow this rhythm:
- Frame Your Question: “Where is ceftriaxone resistance pushing past 5 %?” Having a single query keeps your eyes laser-focused.
- Jump to the Latest Year Column: GLASS arranges years left-to-right, so 2024 or 2025 data hide at the far edge. Red or dark-orange cells = immediate attention.
- Cross-Check the n Column: Scroll left to see how many isolates (n) back up that scary percentage. Anything under 30 warrants caution; tiny sample sizes inflate risk of flukes.
- Peek at Neighbours for Context: Countries trade bugs like tourists trade selfies. If Thailand lights up red and Vietnam is orange, that border just became epidemiologically busy.
- Note the Trend Arrow: Most GLASS sheets include a little ▲▲, ▲, ●, or ▼ flag comparing to the previous year. Two or more ▲ in a row? Time to brace.

People are also reading: HIV Testing at Home: Swap Anxiety for Answers in 20 Minutes
Pattern or Noise? How to Dodge the “Small-n” Trap
Imagine Scotland posting an 11 % ceftriaxone-resistant gonorrhoea rate from only nine lab samples, that’s one resistant strain and eight susceptible ones. Does it spell doom? Maybe. But it could also be a statistical hiccup. The Scottish cluster that went viral on PubMed involved just five confirmed cases, yet it triggered nationwide guideline reviews. So, how do you separate smoke from fire?
- Check Coverage: GLASS lists how many sentinel labs feed each country’s data. Fewer than three labs = potential blind spot.
- Compare to Regional Averages: If neighbours sit at 0–2 % resistance while you spike to double digits on a handful of tests, odds are you’ve caught an outbreak rather than a systemic shift.
- Look for Consistency Over Years: One-year blips happen; two consecutive climbs usually mark a real trend.
- Follow Up with GASP: For Neisseria gonorrhoeae, GASP’s annual bulletin provides lab-confirmed susceptibilities that often validate, or debunk, GLASS wobblers.
Bottom line: patterns need persistence. But noise still matters if it pushes you to test after a risky encounter.
From Spreadsheet to Bedside: Turning Numbers into Personal Action
Okay, you spotted a red cell in a country you just booked for spring break, do you cancel the trip? Probably not. Instead, translate data into real-world moves:
- Before You Go: Pack condoms and a mail-order Gonorrhoea Rapid Test Kit. Vaccinations handle viruses; proactive testing handles bacteria.
- While Abroad: Stick to local treatment guidelines, if pharmacies push outdated drugs, you’re gambling (and feeding AMR).
- Back Home: Test 7–14 days after potential exposure, even if you feel fine. UK authorities warned holiday-makers of “super gonorrhoea” hotspots in Asia after an uptick from two cases a year to two a month.
- Share, Don’t Shame: If positive, tell partners early; rapid treatment curbs resistance spread.
Data isn’t destiny, it’s a roadmap. Use it to steer health decisions instead of catastrophizing.
Resistance Meets Consumption: Reading the AMC Mirror
GLASS isn’t just about bugs; its sibling module, GLASS-AMC, tracks how many milligrams of antibiotics humans swallow per capita. Countries chugging the most broad-spectrum drugs often mirror those with the darkest resistance heat-maps. But there are outliers worth noting:
- High Use, Low Resistance: Nations with robust stewardship, think tight prescription rules and short course durations, can buffer resistance despite high consumption.
- Low Use, High Resistance: Settings with rampant over-the-counter sales (no scripts) see partial courses, the perfect breeding ground for hard-to-kill strains.
For everyday readers, AMC matters because over-using leftover antibiotics at home nudges community resistance upward. Toss expired pills; never split doses. The step after reading the table isn’t to demand stronger drugs, it’s to get tested first so treatment targets the right bug, with the narrowest effective medicine.
Check Your STD Status in Minutes
Test at Home with Remedium8-in-1 STD Test Kit

 For Men & Women
 Results in Minutes
 No Lab Needed
 Private & Discreet
Order Now $149.00 $392.00
For all 8 tests
Five Myths the GLASS Tables Totally Debunk
Scrolling across GLASS can feel like myth-busting bingo. Here are common misconceptions, plus the table cells that prove them wrong:
Myth 1: “Resistance only happens in hospitals.”
GLASS community infection sheets show 30 % fluoroquinolone-resistant E. coli in outpatients from multiple countries.
Myth 2: “Europe is safe; resistance is a low-income issue.”
Spain’s bloodstream Klebsiella data hit 17 % carbapenem resistance in 2024, higher than parts of Africa.
Myth 3: “If my partner is symptom-free, we’re fine.”
Asymptomatic gonorrhoea drives silent spread; GLASS rows flagging 8 % cef-R in Iceland underline no-symptom doesn’t equal no-risk.
Myth 4: “Only multiple antibiotic courses cause AMR.”
Even single mis-dosed treatments create selective pressure. Tables comparing AMC vs AMR reveal spikes after national mass-drug campaigns.
Myth 5: “I can wait for symptoms before testing.”
By the time outbreaks show clinically, GLASS already recorded a resistance climb two years prior. Early testing closes that time-gap.
Why Data Only Matters if You Test
Reading GLASS without follow-through is like checking the weather and leaving your umbrella at home. Surveillance tables signal where antibiotics may flop, but your personal risk hinges on one key variable: have you been screened recently? According to CDC modelling, routine testing plus targeted treatment can halve community gonorrhoea resistance within five years.
That’s why our mantra threads through every section: skim, interpret, then act. A discreet test closes the feedback loop between global trend and individual status. Kits arrive in plain packaging, use painless swabs or finger-pricks, and deliver results you can trust, no awkward clinic queues, no lost work hours. If positive, you jump ahead of resistant strains by treating early and warning partners sooner.
Remember: GLASS tables run one to two calendar years behind real-time. Your body’s biology, however, updates daily. Testing bridges that temporal gap, turning yesterday’s spreadsheets into tomorrow’s safer bedroom decisions.
Your 7-Step GLASS Table Reading Checklist
Need a fridge-magnet version of this guide? Here’s a condensed workflow you can run monthly, or whenever a news report hints at “superbug spread.” Each step is a guardrail against both complacency and data overwhelm.
- Pick a Pathogen: Focus on one, say, Neisseria gonorrhoeae, to avoid cross-eyed confusion.
- Open the Latest Year Column: Jump straight to 2024/2025 cells; anything older is historical context only.
- Scan for Red ≥ 10 %: Flag countries with double-digit resistance as watch-list zones.
- Verify Sample Size (n): Fewer than 30 isolates? Mentally downgrade urgency one notch.
- Compare Neighbours: Regional clusters hint at travel-related spread, plan protection accordingly.
- Cross-Check GASP or National Dashboards: One data stream is good; two in agreement is gospel.
- Decide & Act: If risk touches your travel, dating, or symptom profile, grab a Gonorrhoea Rapid Test Kit and bookmark treatment guidelines before swiping right again.
Run this checklist like brushing teeth, habitual and boring beats sporadic and panicked.
FAQ
1. Is GLASS data really accurate if countries self-report?
Countries follow a standardized WHO protocol and audits, but under-reporting happens. Cross-checking with national dashboards or GASP tightens reliability.
2. Why do some cells say “,” instead of a percentage?
It means the country didn’t submit enough isolates that year; treat the gap as unknown risk, not zero risk.
3. How often are the tables updated?
Annually, with provisional mid-year bulletins during emerging outbreaks.
4. What does “3GC-R” mean?
Resistance to third-generation cephalosporins, such as ceftriaxone or cefotaxime.
5. Can I use GLASS to decide which antibiotic to ask my doctor for?
No, GLASS guides public-health policy, not individual prescriptions. Always follow a clinician’s culture-based choice.
6. Does rising resistance guarantee treatment failure for me?
Not necessarily, but higher percentages raise the odds. Testing and susceptibility‐guided therapy remain your best bet.
7. Are home test kits reliable with resistant strains?
Yes. Rapid antigen or molecular tests detect the pathogen, not its drug profile. If positive, labs can run resistance testing.
8. How soon after exposure should I test?
Seven to fourteen days for gonorrhoea/chlamydia; follow kit instructions and retest if symptoms linger.
9. Do condoms fully protect against resistant STDs?
They reduce risk significantly but aren’t foolproof, hence the need for periodic screening.
10. Where can I see GLASS data without downloading huge PDFs?
WHO’s beta online dashboard (launching late 2025) will offer interactive charts; until then, use the PDF plus this cheat-sheet.
Sources
1. Basic Introduction to Statistics in Medicine, Part 1 – PMC
2. Getting Started with Tables – Archives of Public Health
3. Principles of Presenting Statistical Results: Table – PMC
4. Introduction to 2 × 2 Tables, Study Design & Measures – Oregon State
